Series A funding statistics
I recently spent some time looking at typical Series A investments. I used crunchbase to get the underlying data. And then applied a few filters (like Series A only, USD only, etc.) to get to these results. Here are some important notes with that regard-
Log of Series A is a normal distribution

 Distribution of Categories
 Series A over the years
 Series A by Categories


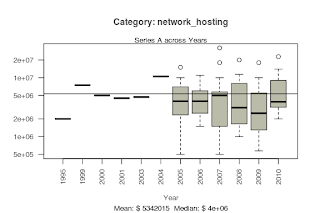


While there are several ways to read into what you see here, it is fun to build your own hypothesis to match the graphs. (For me, I enjoy looking at the outliers that defined 2007/2008) If you believe you have a good hypothesis then please share!
All the analysis was done with the excellent open-source tools R and Python. Email me if you want the scripts or a job pulling fun statistics from large data sets. :-)
- The observations are from companies in the crunchbase db.
- Only companies with Series A funding in USD were looked at.
- Resulting rows: 3730

Median Series A size: $4M
Mean Series A size: $7.05M
Mean Series A size: $7.05M


While there are several ways to read into what you see here, it is fun to build your own hypothesis to match the graphs. (For me, I enjoy looking at the outliers that defined 2007/2008) If you believe you have a good hypothesis then please share!
All the analysis was done with the excellent open-source tools R and Python. Email me if you want the scripts or a job pulling fun statistics from large data sets. :-)
Labels: entrepreneurship, venture
posted by Gagan Saksena @ 9:58 PM
![]()
![]()


0 Comments:
Post a Comment
Subscribe to Post Comments [Atom]
<< Home